Flask+Vue.jsでベイズ最適化アプリを作成してみた
0.はじめに
Flask + Vue.jsで簡単なベイズ最適化アプリを作成したので備忘録がてらまとめておきます。
1.つくりたいもの
以下のような、csv形式のテーブルデータ(property:目的変数、feature:説明変数、説明変数は2つ)を読み込んで目的変数を最大化する条件探索をベイズ最適化によって行うwebアプリケーションを作成します。
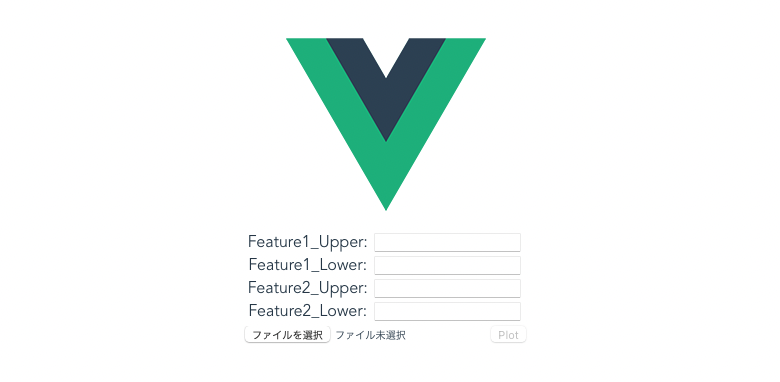
vue.jsで作成したフロントエンドで各変数の取りうる上下限値をフォームに入力、探索初期サンプルの入出力が記載されたcsv形式のデータを読み込みPlotボタンを押すとバックエンドで読み込んだデータを使用してベイズ最適化が行われ、獲得関数マップが表示されます。
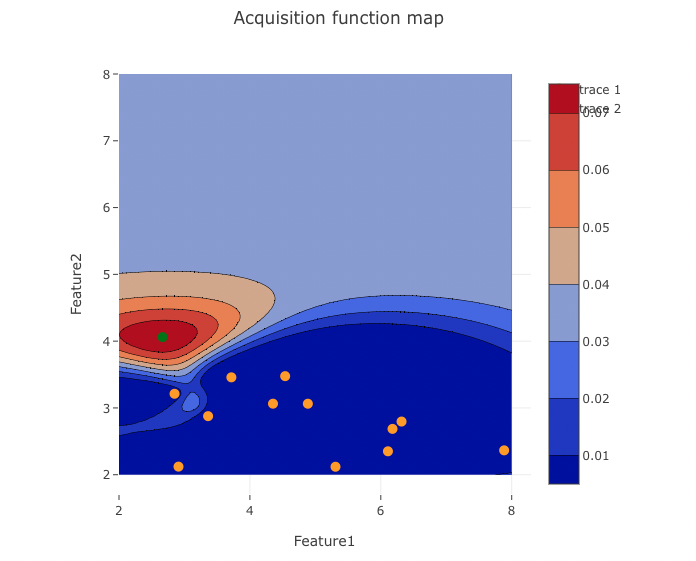
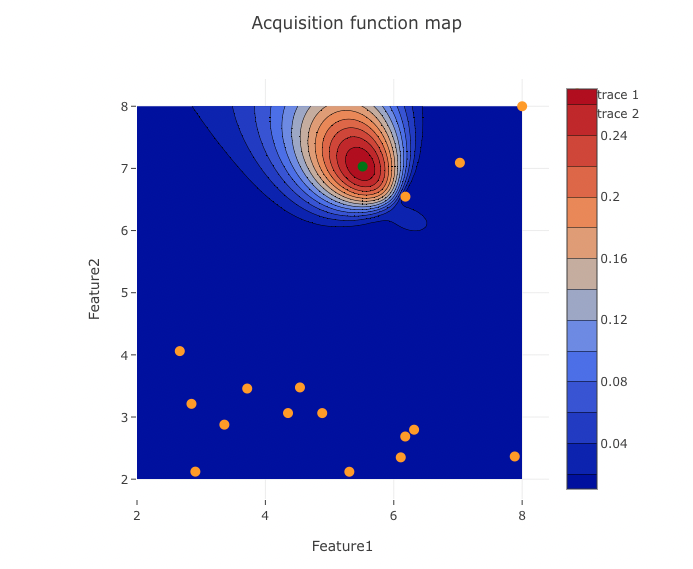
また、獲得関数をもとに次の探索候補点(緑点)が表示されます。実験者は次の探索候補点の条件で再度データ取得を行い、取得したデータを追加し、再度アプリケーションを使用することで対話的に目的変数を最大化する条件の最適化が行えます。
初期サンプルデータ
| No | property | feature_1 | feature_2 |
|---|---|---|---|
| sample_1 | -1.6901378073208400 | 6.17881511358717 | 2.686356032301740 |
| sample_2 | -0.19462331210335700 | 3.716836009702280 | 3.4580994147680800 |
| sample_3 | -0.05709174688868170 | 3.361108721385220 | 2.8771444893592500 |
| sample_4 | -0.5455318144995780 | 5.307888614497350 | 2.1193557932191400 |
| sample_5 | -1.8222159386202400 | 6.316813818713380 | 2.796088510660860 |
作成するアプリの出力
2.バックエンド
バックエンドではフロントエンドで入力したデータと説明変数の上下値を受け取り、ベイズ最適化を行います。
ベイズ最適化によって得られた獲得関数、次の探索候補点座標をjson形式に変換し、フロントエンドへ渡します。
app.py内に定義したエンドポイントをフロントから呼び出すことで上記のjson形式データを渡します。
ベイズ最適化関数はgpbo.py内に関数を定義します。
app.pyとgpbo.pyは同じ階層に配置しておきます。
2.1 事前準備
以下のライブラリをインストールしておきます。
pip install flask
pip install flask_cors
pip install pandas
pip install numpy
pip install scipy
pip install scikit-learn
2.2 スクリプト
app.py
from flask import Flask, jsonify, request, send_file
from flask_cors import CORS
import pandas as pd
import numpy as np
from gpbo import gpbo

app = Flask(__name__)
cors = CORS(app, resources={r"/api/*": {"origins":"*"}} )

#エンドポイントの作成
@app.route('/api/v1.0/gpbo', methods=['POST'])
def upload():
    # フロントエンドで入力したCSVファイルを受け取る
    csv_file = request.files['file']

    # ファイルをPandasのデータフレーム形式に変換する
    df = pd.read_csv(csv_file, index_col=0)
    print(df.head())
    print('ファイルをアップロードしました')

    #探索の上下限の設定
    lower_feature1 = int(request.form['Feature1_Lower'])
    upper_feature1 = int(request.form['Feature1_Upper'])
    lower_feature2 = int(request.form['Feature2_Lower'])
    upper_feature2 = int(request.form['Feature2_Upper'])

    # x, y の値域を指定(探索範囲内メッシュデータ、獲得関数マップを描画する目的)
    x_= np.linspace(lower_feature1, upper_feature1, 100)
    y_ = np.linspace(lower_feature2, upper_feature2, 100)
    X, Y = np.meshgrid(x_, y_)

    #ベイズ最適化により次の探索点を提案、獲得関数の値
    z_, next_sample = gpbo(df, X, Y)

    #これまでのサンプルデータ、探索範囲内データ、次の探索点をjson形式で出力する。
    data = {'x':df.iloc[:,1].values.tolist(), 'y':df.iloc[:,2].values.tolist(),'x_':x_.tolist(), 'y_':y_.tolist(), 'z_':z_.tolist(),'x_next':next_sample.iloc[:,0].values.tolist(), 'y_next':next_sample.iloc[:,1].values.tolist()}

    return jsonify(data)

if __name__ == '__main__':
    app.run(debug=True)
gpbo.py
import pandas as pd
import numpy as np
from scipy.stats import norm
from sklearn.model_selection import KFold, cross_val_predict
from sklearn.gaussian_process import GaussianProcessRegressor
from sklearn.gaussian_process.kernels import WhiteKernel, RBF, ConstantKernel, Matern, DotProduct
from sklearn.metrics import r2_score, mean_squared_error, mean_absolute_error


def gpbo(dataset, X, Y):

    acquisition_function = 'EI'

    fold_number = 4  # クロスバリデーションの fold 数
    kernel_number = 2  # 0, 1, 2, 3, 4, 5, 6, 7, 8, 9, 10
    relaxation = 0.01  # EI


    # データ分割
    y = dataset.iloc[:, 0]  # 目的変数
    x = dataset.iloc[:, 1:]  # 説明変数

    #テストデータの設定
    X_ = X.reshape(-1)
    Y_ = Y.reshape(-1)
    x_prediction = pd.DataFrame()
    x_prediction['feature_1'] = X_
    x_prediction['feature_2'] = Y_

    autoscaled_x_prediction = (x_prediction - x.mean()) / x.std()


    # カーネル 11 種類
    kernels = [ConstantKernel() * DotProduct() + WhiteKernel(),
            ConstantKernel() * RBF() + WhiteKernel(),
            ConstantKernel() * RBF() + WhiteKernel() + ConstantKernel() * DotProduct(),
            ConstantKernel() * RBF(np.ones(x.shape[1])) + WhiteKernel(),
            ConstantKernel() * RBF(np.ones(x.shape[1])) + WhiteKernel() + ConstantKernel() * DotProduct(),
            ConstantKernel() * Matern(nu=1.5) + WhiteKernel(),
            ConstantKernel() * Matern(nu=1.5) + WhiteKernel() + ConstantKernel() * DotProduct(),
            ConstantKernel() * Matern(nu=0.5) + WhiteKernel(),
            ConstantKernel() * Matern(nu=0.5) + WhiteKernel() + ConstantKernel() * DotProduct(),
            ConstantKernel() * Matern(nu=2.5) + WhiteKernel(),
            ConstantKernel() * Matern(nu=2.5) + WhiteKernel() + ConstantKernel() * DotProduct()]

    # オートスケーリング
    autoscaled_y = (y - y.mean()) / y.std()
    autoscaled_x = (x - x.mean()) / x.std()
    autoscaled_x_prediction = (x_prediction - x.mean()) / x.std()

    # モデル構築
    selected_kernel = kernels[kernel_number]
    model = GaussianProcessRegressor(alpha=0, kernel=selected_kernel)

    model.fit(autoscaled_x, autoscaled_y)  # モデル構築
    # 予測
    estimated_y_prediction, estimated_y_prediction_std = model.predict(autoscaled_x_prediction, return_std=True)
    estimated_y_prediction = estimated_y_prediction * y.std() + y.mean()
    estimated_y_prediction_std = estimated_y_prediction_std * y.std()

    # 獲得関数の計算
   acquisition_function_prediction = (estimated_y_prediction - max(y) - relaxation * y.std()) * norm.cdf((estimated_y_prediction - max(y) - relaxation * y.std()) / estimated_y_prediction_std) + estimated_y_prediction_std * norm.pdf((estimated_y_prediction - max(y) - relaxation * y.std()) / estimated_y_prediction_std)

    acquisition_function_prediction[estimated_y_prediction_std <= 0] = 0

    estimated_y_prediction = pd.DataFrame(estimated_y_prediction, x_prediction.index, columns=['estimated_y'])
    estimated_y_prediction_std = pd.DataFrame(estimated_y_prediction_std, x_prediction.index, columns=['std_of_estimated_y'])
    acquisition_function_prediction = pd.DataFrame(acquisition_function_prediction, index=x_prediction.index, columns=['acquisition_function'])

    # 次のサンプル
    next_sample = x_prediction.loc[acquisition_function_prediction.idxmax()]

    return acquisition_function_prediction.values.reshape(X.shape[0], Y.shape[0]), next_sample
2.3 実行
以下のコマンドを実行して、バックエンドサーバーを立ち上げます。
python app.py
すると、http://localhost:5000にバックエンドサーバーが立ち上がります。
3.フロントエンド
Vue.js(Vue-CLI)を使用してフロントエンドを作成します。 csvデータとフォームに入力した説明変数の上下値をバックエンドに渡し、バックエンドでベイズ最適化が行われた戻り値を受け取り、コンター図を描画する機能を実装します。
3.1 事前準備
node.jsをインストールしておく必要があります。node.jsのインストール
インストール後、npmコマンドが実行できることを確認してください。
以下のコマンドを実行してVueをインストールします。
npm install -g @vue/cli
vueの新しいプロジェクトを作成します。
npm init webpack my-project
(Y / n)を押して選択
矢印キーで選択してEnter
? Project name my-project
? Project description A Vue.js project
? Author
? Vue build standalone
? Install vue-router? Yes
? Use ESLint to lint your code? Yes
? Pick an ESLint preset Standard
? Set up unit tests Yes
? Pick a test runner jest
? Setup e2e tests with Nightwatch? No
? Should we run `npm install` for you after the project has been created? (recommended) npm
質問が終わるとプロジェクトの作成が始まります。
終了すると、実行ディレクトリ/プロジェクト名配下にファイルが作成されました。
ファイルが作成されたことを確認し、
cd my-project
npm run dev
上記のコマンドを実行すると、vueアプリケーションがhttp://localhost:8080に立ち上がります。
アクセスして確認してください。
今回のアプロケーションではflaskバックエンドapiとhttpクライアントのaxiosによって通信を行うので、axiosをインストールします。
npm install axios --save
また、flaskバックエンドapiで受け取ったデータを用いてフロントエンドで獲得関数マップの描画を行うため、plotly.jsをインストールします。
npm install plotly.js
3.2 ディレクトリ構造
3.1でvueプロジェクトを作成すると以下のディレクトリが作成されています。
.
├── README.md
├── build
├── config
├── index.html
├── node_modules
├── package-lock.json
├── package.json
├── src
└── static
今回は./srcディレクトリ内のcomponentsディレクトリ内にFigure.vueを追加し、Figure.vueをflaskバックエンドapiを受け取って、獲得関数マップを表示するフロントエンドして機能させます。
また、index.jsにFigure.vueのルーティングを追加します。
.
├── App.vue
├── assets
│   └── logo.png
├── components
│   ├── Figure.vue
│   ├── HelloWorld.vue
|
├── main.js
└── router
    └── index.js
3.3 スクリプト
Figure.vue
<template>
  <div>
    <form>
      <div>
        <label for="feature1_upper">Feature1_Upper:</label>
        <input type="text" id="feature1_upper" v-model="feature1_upper">
      </div>
      <div>
        <label for="feature1_lower">Feature1_Lower:</label>
        <input type="text" id="feature1_lower" v-model="feature1_lower">
      </div>
      <div>
        <label for="feature2_upper">Feature2_Upper:</label>
        <input type="text" id="feature2_upper" v-model="feature2_upper">
      </div>
      <div>
        <label for="feature2_lower">Feature2_Lower:</label>
        <input type="text" id="feature2_lower" v-model="feature2_lower">
      </div>
    </form>
    <input type="file" ref="fileInput" @change="onFileSelected">
    <button @click="drawPlot" :disabled="!dataLoaded">Plot</button>
    <div ref="plot" class="plot"></div>
  </div>
</template>

<script>
import axios from 'axios'
import Plotly from 'plotly.js'

export default {
  data () {
    return {
      feature1_upper: '',
      feature1_lower: '',
      feature2_upper: '',
      feature2_lower: '',
      x_: [],
      y_: [],
      z_: [],
      x: [],
      y: [],
      x_next: [],
      y_next: [],
      dataLoaded: false
    }
  },
  methods: {
    onFileSelected (event) {
      const file = event.target.files[0]
      const formData = new FormData()
      formData.append('file', file)
      formData.append('Feature1_Upper', this.feature1_upper)
      formData.append('Feature1_Lower', this.feature1_lower)
      formData.append('Feature2_Upper', this.feature2_upper)
      formData.append('Feature2_Lower', this.feature2_lower)
      axios.post('http://127.0.0.1:5000/api/v1.0/gpbo', formData)
        .then(response => {
          this.x = response.data.x
          this.y = response.data.y
          this.x_ = response.data.x_
          this.y_ = response.data.y_
          this.z_ = response.data.z_
          this.x_next = response.data.x_next
          this.y_next = response.data.y_next
          this.dataLoaded = true
        })
        .catch(error => {
          console.log(error)
        })
    },
    drawPlot () {
      const trace = {
        x: this.x_,
        y: this.y_,
        z: this.z_,
        type: 'contour'
      }
      const scatterTrace = {
        x: this.x,
        y: this.y,
        mode: 'markers',
        type: 'scatter',
        marker: {
          color: 'orange', // 色をzに設定する
          size: 10 // サイズを10に設定する
        }
      }
      const scatterTrace2 = {
        x: this.x_next,
        y: this.y_next,
        mode: 'markers',
        type: 'scatter',
        marker: {
          color: 'green', // 色をzに設定する
          size: 10 // サイズを10に設定する
        }
      }
      const layout = {
        title: 'Acquisition function map',
        xaxis: {
          title: 'Feature1'
        },
        yaxis: {
          title: 'Feature2'
        }
      }
      Plotly.newPlot(this.$refs.plot, [trace, scatterTrace, scatterTrace2], layout)
    }
  }
}
</script>
<style>
.plot {
  width: 600px;
  height: 600px;
  margin: auto;
}
</style>
※バックエンドのローカルアドレスをhttp://localhost:5000とするとエラーが出てしまいました。
index.js
import Vue from 'vue'
import Router from 'vue-router'
import Figure from '@/components/Figure'

Vue.use(Router)
export default new Router({
  mode: 'history',
  routes: [
    {
      path: '/figure',
      name: 'Figure',
      component: Figure
    }
  ]
})
3.4 実行
npm run dev
を実行するとフロントエンドサーバーがhttp://localhost:8080に立ち上がります。
今回作成したベイズ最適化アプリはhttp://localhost:8080/figureに立ち上がります。
4.使用例
下記のような解が既知である問題に対して、今回作成したベイズ最適化アプリを使って目的変数が最大となる解の探索を行なってみます。

出力関数は以下です。
def f(x,y):
    return np.cos(x) + np.cos(y)+ np.cos(x+y)+ np.cos(x-y)
初期サンプル(オレンジの点)を10点とり、ベイズ最適化を実行し、獲得関数をアプリで可視化、次の探索点で評価(上式に代入)、テーブルデータに追加を繰り返します。
1回目
2回目
 3回目
3回目
4回目

作成したベイズ最適化アプリを使用することで獲得関数マップを確認しつつ、8回の試行でおおよそ目的変数が最大となる2変数の組み合わせを見つけられました。
5.参考
https://github.com/hkaneko1985/python_doe_kspub
Vue.js(vue-cli)とFlaskを使って簡易アプリを作成する【前半 - フロントエンド編】
Vue.js(vue-cli)とFlaskを使って簡易アプリを作成する【前半 - バックエンド編】
Flaskを勉強するのに下記の書籍を参考にしました。
